Graphing the Play Counts of Taylor Swift Songs
September 24, 2014 | 1 min read

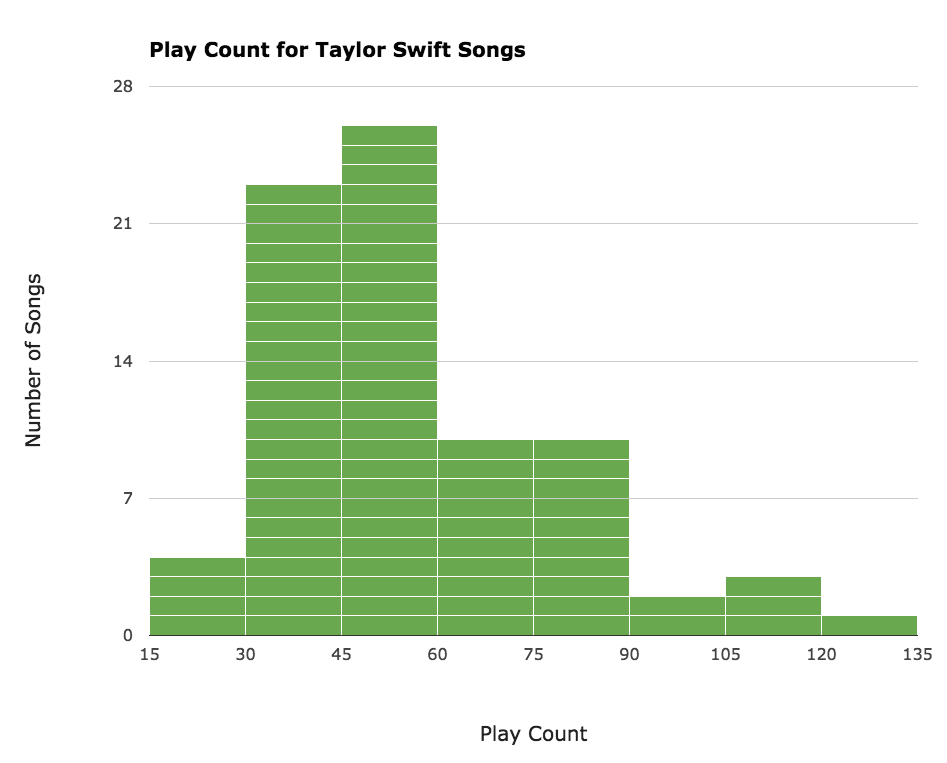
This is a histogram showing the play counts in my music library for all of the songs on all four of Taylor Swift’s studio albums.
Shape
The histogram is unimodal, which is unsurprising. I like most of the songs, dislike few, and really like a few. Also, the histogram is skewed right. This makes sense as I often put all four albums on shuffle, so every song gets a fair amount of plays. There are, however, some songs that I will purposely listen to, and they make up the tail of the histogram.
Outliers
There are no outliers, which means that even my favorite songs—Enchanted, White Horse, Fifteen1—don’t get played that much more than the other songs. I think having no outliers is my proof that I’m not that self-proclaimed “superfan” who listens only to her number one hits; I’m the real deal.
Center
On average, I have played each song 57 times.
Spread
The standard deviation is about 22.
-
A non-exhaustive list. ↩